The martelosim R package Quick User guide
Simulating the evolution of a marteloscope following a marking and over a period of several decades with thinning
Source:vignettes/martelosim.Rmd
martelosim.RmdIntroduction
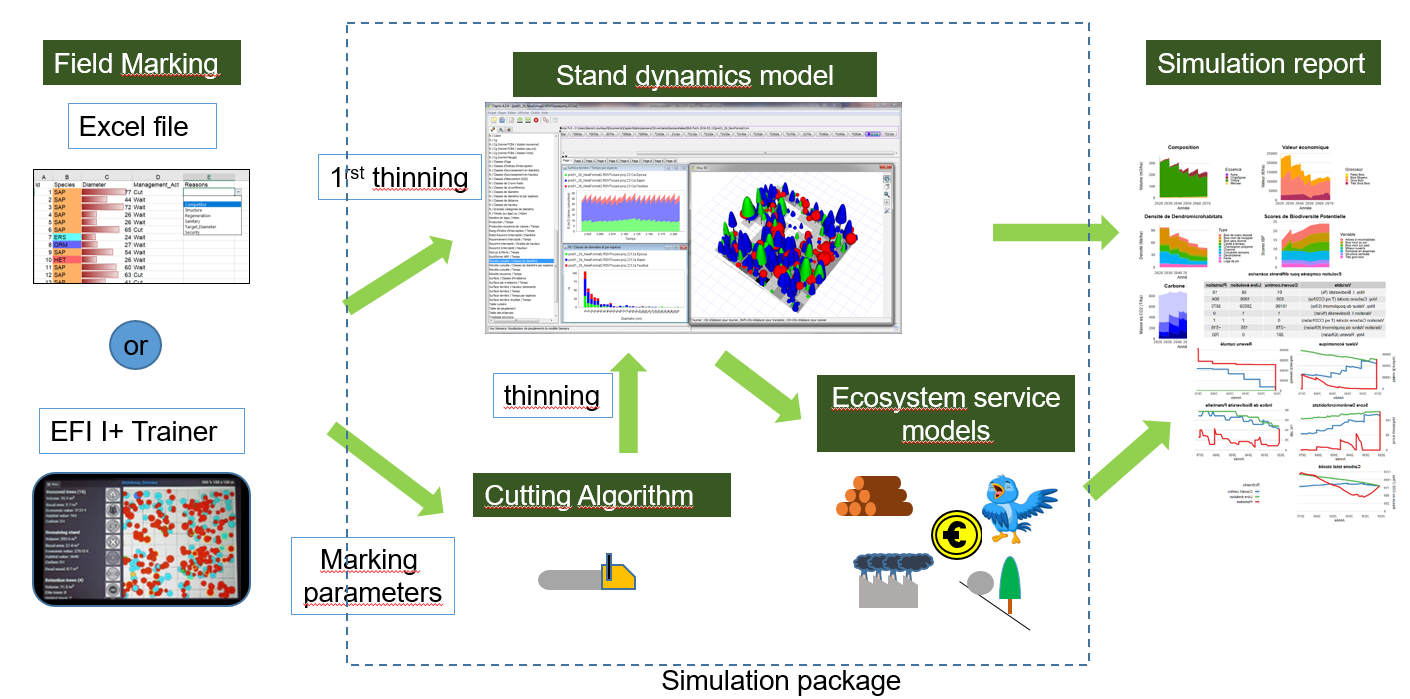
The martelosim package is a tool making possible to simulate the evolution of a marteloscope over several decades, a first thinning corresponding to the marking made on the field and later thinning reproducing a strategy deduced from the field marking.
The package uses the model Samsara2 (Lafond et al. (2017), Benoit Courbaud et al. (2016), B. Courbaud et al. (2015)), which is a module of the software CAPSIS. It proposes a specific interface for marteloscopes that facilitates the preparation of all the files describing the marteloscope initial conditions, the loading of field marking information during a marking exercise, the simulation processing, and the production of a standardized output report.
The package is designed to be run by the marteloscope instructor on a computer. During a marteloscope exercise, each marking group enters his marking data on a tablet (we propose an Excel file by default. The EFI I+Trainer can be used also for this step). The marteloscope instructor collects all the marking files and runs the simulations for all the groups on his computer. The package produces a personalized simulation report for each group.
Here are the steps you have to follow: - Install the martelosim package on the marteloscope trainer’s computer: - Test the martelosim package making a virtual workshop on the marteloscope of Prelenfrey - Set up your marteloscope on the field - Prepare a marteloscope workshop on your computer and your tablets - Test the simulator on a random marking - Carry out the marking on the field - Simulate the results of a marteloscope exercise
Software installation
Installing Java
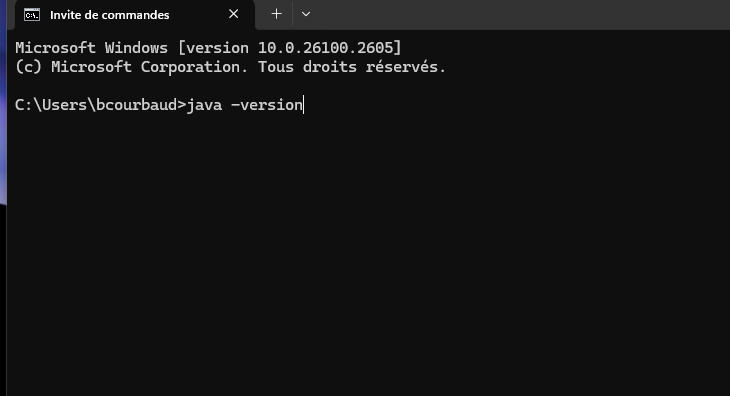
Java is usually already installed in most computers. However, for
Capsis, you need a version 1.8.xxx of Java. To check
the version of Java on your computer, - Open a MS-DOS command prompt (on
Windows) - type : java –version
If you don’t have a Java 1.8.xxx on your computer, download a “Java SE Runtime Environnement 8” on your machine, https://java.com/en/download/manual.jsp (for Windows choose an offline version) https://www.oracle.com/java/technologies/javase-jre8-downloads.html (subscription is mandatory on this site)
Installing Capsis
Run the Capsis installer provided to you by LESSEM
- Double click on the installer file :
capsis_Samsara2_version_setup.jar - Choose a name and location for your Capsis folder (for example
/My documents/Capsis). - Caution, the path to your Capsis folder must not contain names with accents.
- Remember this location and path, because you’ll need it later.
- For more information, see : http://capsis.cirad.fr/capsis/documentation/installation_guide
Be careful : the Capis version must be compatible with the R package
version you install. The last stable version of
martelosim require version 4.2.7-22277 for
Capsis.
Installing R and Rstudio
Link to install R : https://cran.r-project.org/bin/windows/base/
Link to install RStudio : https://posit.co/download/rstudio-desktop/
Installing the R package martelosim
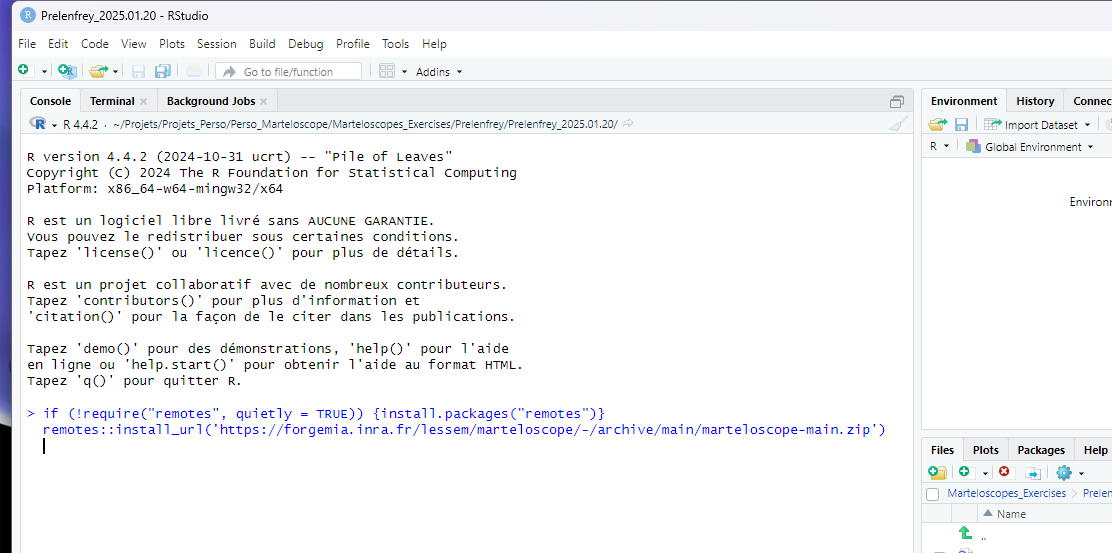
Open R studio or close any project and paste one of the following commands in the console:
If you are a marteloscope instructor
You should install the last stabilized version of the package, copying and pasting the command line:
if (!require("remotes", quietly = TRUE)) {install.packages("remotes")}
remotes::install_url('https://forge.inrae.fr/lessem/rpackages/martelosim/-/archive/main/martelosim-main.zip')
Restart R either in closing and reopening RStudio or by copying and
pasting the command .rs.restartR()
If you are a researcher
You can install the current development version with the command line:
if (!require("remotes", quietly = TRUE)) {install.packages("remotes")}
remotes::install_url('https://forge.inrae.fr/lessem/rpackages/martelosim/-/archive/dev/martelosim-dev.zip')
Restart R either in closing and reopening RStudio or by copying and
pasting the command .rs.restartR()
The documentation of the R package martelosim is available here: https://martelosim-lessem-d3ee0b35d60b232cf2359e16b807e838c535e5a39f3.pages.mia.inra.fr/index.html
Using the R package martelosim
You have to prepare in advance a marteloscope exercise by following the 3 steps in sequence:
- Testing the martelosim package making a virtual workshop on the marteloscope of Prelenfrey
- Testing the package on your own marteloscope with a random marking
- Using the package during a marking exercise
Testing the package on a virtual workshop on the marteloscope of Prelenfrey
Create a directory and an R project to simulate a marteloscope workshop on the marteloscope of your choice
On your windows explorer create a directory where you will store all
your marteloscope exercises, and a subdirectory for each marteloscope.
Ex: martelosim_Workshops/Prelenfrey
- Open RStudio
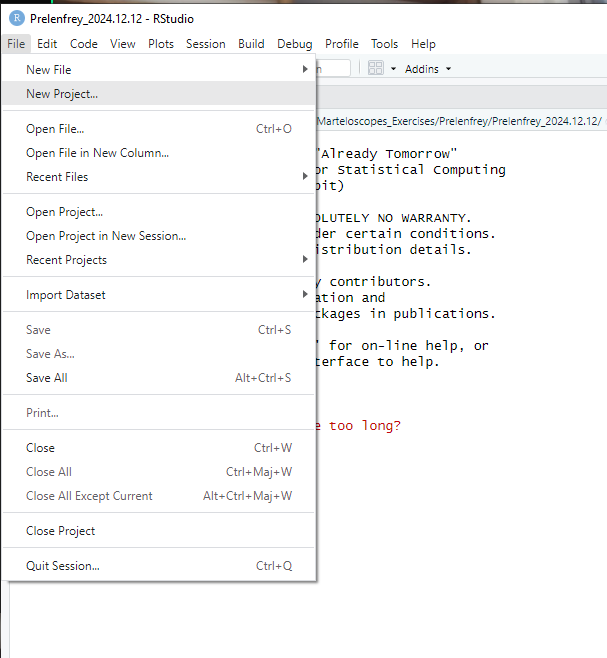
File/New project(in the upper left menu bar)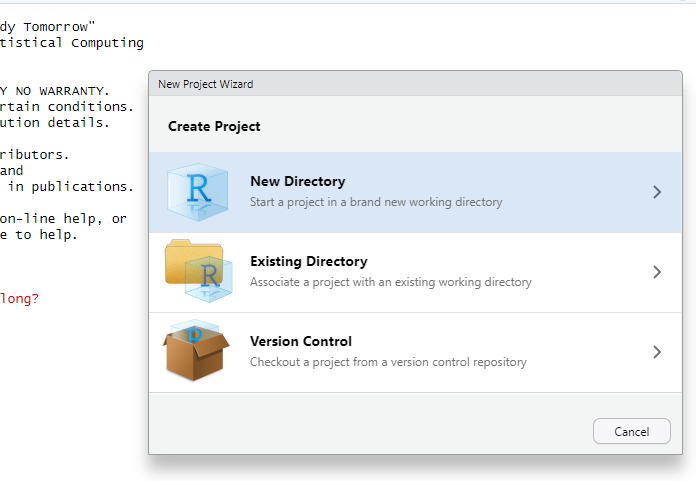
New directory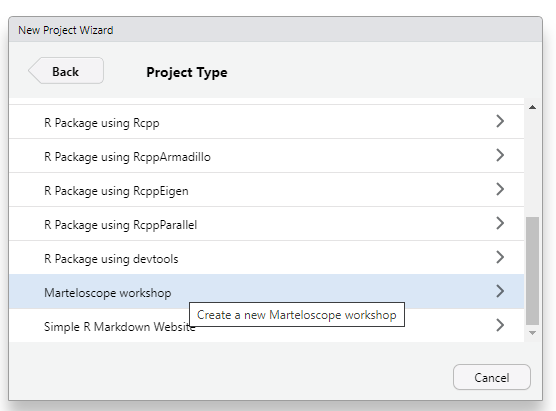
martelosim workshop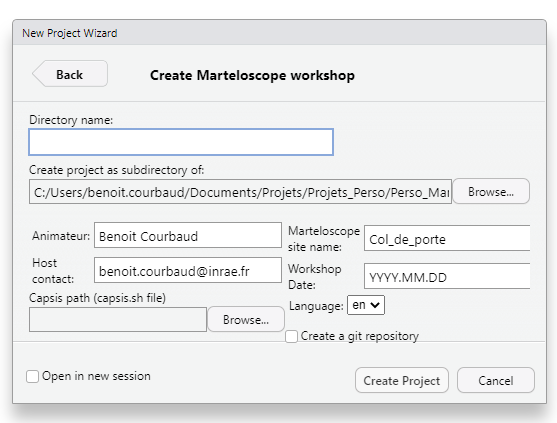
Creation menu
-
Directory name: we suggest that you create a directory named with the marteloscope and the date of your exercise: exPrelenfrey_2024.11.19. You can create right away a succession of directories to organize your marteloscopes and future workshops. (ex :martelosim_Workshops/Prelenfrey/Prelenfrey_2024.11.19) -
Subdirectory of: indicate the folder in which you want to store the directory of your exercise : exmartelosim_Workshops/Prelenfrey -
Marteloscope site name: Repeat the Marteloscope name : exPrelenfrey -
Workshop Date: Repeat the workshop date : ex2024.11.19 -
Capsis path: Click onBrowseand develop the pathway up to your Capsis folder and select the file capsis.sh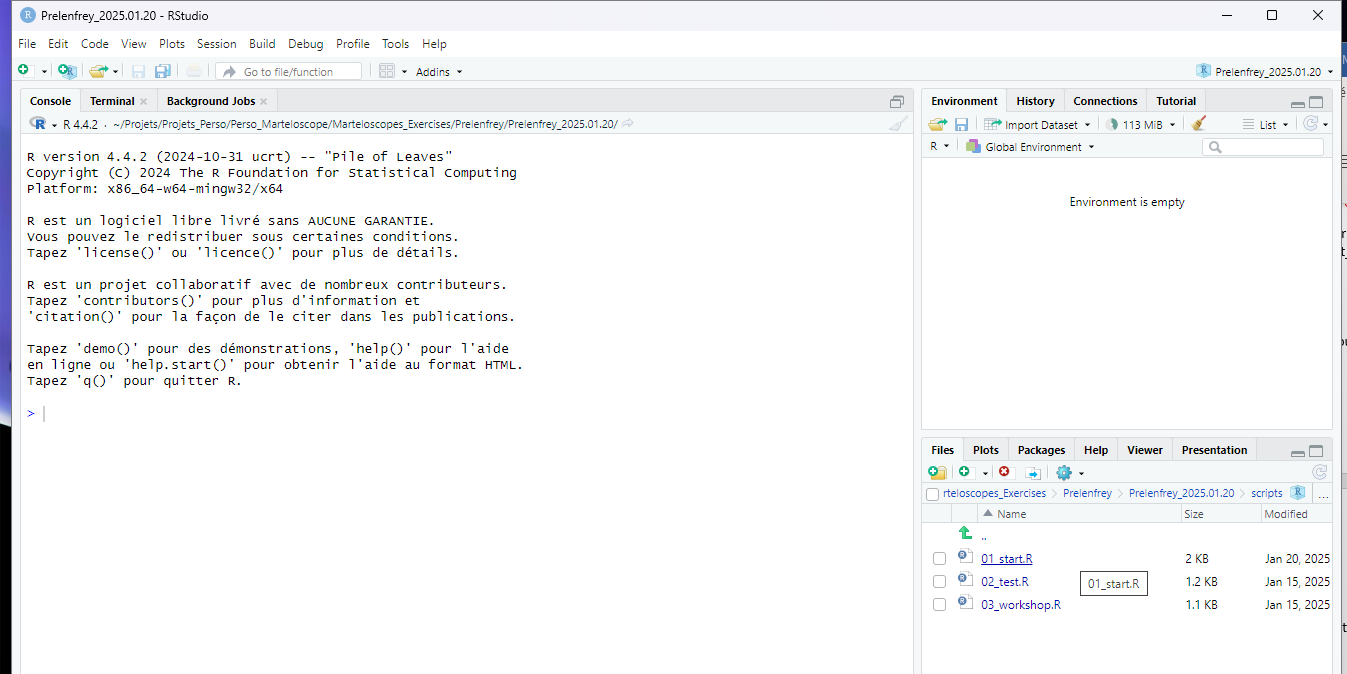
martelosim project
- Create project
-
- The dialogue box creates a folder for your exercise (ex:
Prelenfrey_2024.11.19) In this folder, you find- The R project for the exercise (ex:
Prelenfrey_2024.11.19.Rproj) - Subfolders : scripts, data, martelages, reports
- The R project for the exercise (ex:
- RStudio opens your project (ex:
Prelenfrey_2024.11.19.Rproj).
Run the script 01_start.R
This script prepares the files describing your marteloscope initial conditions. You have to run it before each exercise.
If R studio has not opened script_01_start.R, go in the RStudio
bottom right window. Select the tab Files, open the
directory scripts and double click on the file
scripts/01_start.R
To run a RStudio script, click on each line of code and type
Ctrl Enter , it will run the code section by section.
-
martelosim::martelosim_options()displays the indications for your workshop. You can check that they are correct. -
martelosim::new_inventory()copies the Excel file of field data, provided by INRAE and in a format suitable for Samsara2, in the subdirectory “data” of your exercise and checks its name :- The option site =
Prelenfreywill copy the example file of Prelenfrey stored in the package. This is what we suggest to do to test the package the first time. In our example, this file will be named:martelosims_Workshops/Prelenfrey/Prelenfrey_2024.11.19/data/Data_Marteloscope_Prelenfrey.xlsx - The option site =
newprovide an empty Excel file of field data if you have not already completed it. - The option lang =
getOption("mart_lang"): the language (English or French) will correspond to what you have indicated previously in the create marteloscope box. - If the option
open = TRUE, then the Excel file is open and you can check the Prelenfrey data file. You have to close the Excel file before continuing running the R code.
- The option site =
-
martelosim::build_samsa2_files()- Creates the files of initial conditions used by the simulator
Samsara2 and store them in the subdirectory
data. These files will be used by the simulator Samsara2 to make simulations. - Creates in the folder
markings, the default marking filemarkings/Prelenfrey_2024.11.19_Marking_X.xlsxwhich can be used on the field to enter marking data for the marking group X.
- Creates the files of initial conditions used by the simulator
Samsara2 and store them in the subdirectory
-
martelosim::prepare_samsara()omplements field data if your marteloscope is not rectangular or if you have not measured the regeneration on the field.- the option
create_periphery = TRUEmeans that virtual trees will be created in a rectangular plot around the marteloscope to manage border conditions for light calculations - The option
create_virtual_saplings = TRUEmeans that virtual saplings in balance with the adult tree stand and ground light conditions are created.
- the option
-
martelosim::martelo_maps()creates a pdf file with maps to help you locate interesting trees on the field. These maps are stored in the folderreports. (ex:reports/Prelenfrey_Maps.pdf). -
navigateToFile(« script 02_test.R »)opens the script used for the next step.
Run the script 02_test.R
This script runs marteloscope marking exercise with a random marking in order to test the whole process.
-
martelosim::random_marking()creates a virtual marking file in the subdirectorymarkingswhere trees have been selected randomly. It makes a marking file similar to a field marking file. In our example:markings/Prelenfrey_2024.11.19_Marking_Random.xlsx -
MarkingGroups <- c("Random")means you are working with marking made by the virtual marking group calledRandom -
write_samsara_cmd()creates the file dataPrelenfrey_CommandFile.txtin thedatafolder. This command file plans all the simulation steps for Samsara2. The option :-
marking_groups = MarkingGroupsmeans that the simulation will be made for the groups named in the MarkingGroup vector -
thinning_time = 10means that a thinning will be applied every 10 years. The first one will be the field marking, the newt ones will be made using the Multicriteria_Thinner of Samsara2 mimicking the same kind of marking strategy than the field marking. -
evolution_time = 20means that the simulation will cover 20 years. -
silviculture = "auto"means that the parameters of the Muticriteria_Thinner will be automatically deduced from the field marking.
-
-
run_samsara()runs the simulations for the the random marking and stores result files in the folderdata/Output. It takes approximately 1 minutes for a 20 year evolution simulation. - martelo_report() writes a PDF report for the marking group and
stores it in the “reports” folder. In our example:
“reports/Prelenfrey_2024.11.19_Random_Report.pdf”. The option:
-
marking_groups = MarkingGroupsmeans that the report will be made for the groups named in the MarkingGroup vector. -
dendrometry = TRUE, etc… means that the report will include pages for all these topics.
-
The scripts 03_workshop.R is for a real marking
exercise, not needed if you just want to test the package on a virtual
marteloscope with a random marking.
Testing the package on your own marteloscope
Objectives: - Check that the data in your marteloscope is correctly formatted - Check that the process is running correctly on your marteloscope - Test the production and storage of a field marking data file on tablets - Test the transfer of data between tablets and computer - Test the whole process of simulation based on a field marking
Prepare your marteloscope field data in the Excel template
Specific data describing the initial conditions of your marteloscope
are required to run simulations. Organize your data in an Excel file
corresponding the templates
Data_Marteloscope_template_en.xlsx or
Data_Marteloscope_template_fr.xlsx. You can look at
Data_Marteloscope_Prelenfrey_en.xlsx for an example and
save it with a name corresponding to your marteloscope (ex
Data_Marteloscope_MyMarteloscope_en.xlsx). The page
Notice describes the variables to fill and indicates which
data is mandatory or optional. Please follow exactly the required data
formats otherwise the martelosim package will not be able to read the
data correctly. The file contains many pages but several of them are
metadata not field data (ex: regeneration size class definitions, price
per species, quality and size) and a lot is optional. If you don’t fill
optional data, Samsara2 will use default values or simulate virtual
objects (ex virtual saplings)
If you have installed your marteloscope following the EFI Integrate+ protocol, you will have some data transformation to make and some additional data to inform but it should not be a big deal. For Samsara2, you have to give only one quality to the whole tree. Samsara2 requires a Z coordinate for every tree in order to calculate light interception correctly. If you have not measured it on the field, you can let this variable empty. An approximate Z will be calculated using the marteloscope average slope and exposure.
If you need to calculate tree X, Y and Z coordinates from field
measures of distances, azimuth and vertical angles between reference
poles and trees, you can use the additional
martelo-main.zip R code by Jean-Matthieu Monnet to convert
field measures into X,Y, Z coordinates.
Create a directory and an R project to simulate a marteloscope workshop on the marteloscope of your choice - Before each exercise
A new R project must be created before each exercise. Follow the same
instructions as in part 3.1.1. changing Prelenfrey and
2024.11.19 by your own marteloscope name and exercise
date.
Run the script 01_start.R - Before each exercise
Before the exercise, run 01_start.R to prepares the
files describing your marteloscope initial conditions. Follow the same
instructions as in part 3.1.2. Note that :
-
martelosim::new_inventory()copies the Excel file of field data in the subdirectorydataof your exercise and checks its name :- The option site =
newwill copy the data file template in the folder “data” with the name of your marteloscope and date of your exercise. If the optionopen = TRUE, then the Excel file is opened directly. You can fill it with your own data. You have to close the Excel file before continuing running the R code. - The option site =
copy, opens a popup window to copy a data file you have already prepared and stored anywhere on your computer. If the popup window does not open directly it may appear on the bottom bar of your screen. Be careful that the format of the file is correct.
- The option site =
- If the following code doesn’t work, first check for errors in your data file.
Run the script02_test.R to test a random marking
To run a simulation with a random marking, follow the instructions in Run the script 01_start.R
Prepare the field tablets - Before going to the field
- To enter on the field the marking made by a marking group, you have to prepare on each tablet either the simple Excel file provided by in the package or the I+Trainer software. It is a good precaution to prepare the Excel file in any case.
- To transfer files between your computer and your tablets, you can use the cable of your tablet charger. Authorize the transfer. The tablet becomes an extension of your computer. Use the windows explorer on your computer to create folders and copy files on the tablet.
Case 1: You intend to use the simple Excel file provided with the package
- Create a folder for your marteloscopes on each tablet. (ex:
Internal storage/Documents/Marteloscopes/MyMarteloscope/) - To speed up file transfers when you carry out a real exercise, we
recommend that you prepare shortcuts on your tablet’s desktop to the
Marteloscopesdirectory. - Transfer from your computer to the tablet the Excel marking file
that has been prepared on your computer when running the project
script_01.R. For example:YourMarteloscopeName_YYYY.MM.DD_Marking_X.xlsx. Change the name of the file with the correct tablet name or marking group name (ex:YourMarteloscopeName_ YYYY.MM.DD _Marking_A.xlsxfor group A) - Transfer also on the tablet the map of the marteloscope: it will be helpful to navigate on the field.
Case 2: You intend to use the I+Trainer software
- If the marteloscope is registered in the European Forest Institute marteloscope database, you can use the I+Trainer instead of the Excel file to enter the field marking data. To discover this software see: http://iplus.efi.int/
- In that case, when you finish the field marking exercise on the
I+Trainer, you will have to save the result file on the tablet directory
Internal storage/iplus/which has been created automatically when installing the I+Trainer on your tablet. - To speed up file transfers when you carry out a real exercise, we
recommend that you prepare shortcuts on your tablet’s desktop to the
I+Trainer software and to the
Internal storage/iplus/directory.
Make a virtual field marking on your tablet – On the field
Case 1: You use the default Excel marking file provided with the package
- The marking group opens the Excel file. A table presents all the
trees of the marteloscope with their species and diameter. By default,
the
Actioncolumn has been filled with the keywordWaitwhich mean that you don’t do anything on this tree. If you click on the box, you can choose among the actions: “Cut”,Wait,PromoteorRetain. You can select a reason for your choice in the columnReason. - Transfer the marking file on the marteloscope instructor’s computer
in the
markingsfolder for simulation. Check that the name of the file is correct. it should follow the rule:YourMarteloscopeName_ YYYY.MM.DD _Marking_YourGroup.xlsx.
Case 2: You use the field the I+Trainer software
- Alternatively, make a virtual field marking using the I+Trainer.
When you finish the exercise, be careful to save the marking on your
tablet:
Save results on the device-> Save final results on the SD card, create PDF and restart the application. A csv result file is automatically saved in the directoryInternal storage/iplus/with a long name given by Iplus (exBenoit_Prelenfrey_France_2024-10-02_1557.csv). You will have to change this name by a Samsara2 compatible name (YourMarteloscopeName_YYYY.MM.DD_Marking_YourGroup.csv) either now or later on your computer. - Transfer the marking file on the marteloscope instructor’s computer
in the
markingsfolder for simulation. Check that the name of the file is correct. it should follow the rule:YourMarteloscopeName_ YYYY.MM.DD _Marking_YourGroup.csv
Run the script 03_workshop.R to simulate the field marking - After the marking
This script runs marteloscope marking exercise in order to test the whole process.
find_marking()reads the making file template. You can check that it identifies all of your marking files. If the optionopen = TRUE, the Excel sheet is opened to be checked. You have to close the Excel sheet before going on.Choose the names of the marking groups for which you want to run the simulation by completing the
MarkingGroups <- c("Random","X")(ex:MarkingGroups <- c("A","B","C")if your groups are named A, B and C).-
write_samsara_cmd()(as in Run the script 01_start.R) creates the file dataYourMarteloscopeName_Martelo_CommandFile.txt. This command file plans all the simulation steps for Samsara2. The option :-
marking_groups = MarkingGroupsmeans that the simulation will be made for the groups named in the MarkingGroup vector -
thinning_time = 10means that a thinning will be applied every 10 years. The first one will be the field marking, the newt ones will be made using the Multicriteria_Thinner of Samsara2 mimicking the same kind of marking strategy than the field marking. -
evolution_time = 20means that the simulation will cover 20 years. -
silviculture = "auto"means that the parameters of the Muticriteria_Thinner will be automatically deduced from the field marking.
-
run_samsara()runs the simulations for the marking groups you have chosen in the creation of the CommandFile and stores result files in the folder data.-
martelo_report()writes a PDF report for the marking group and stores it in the “reports” folder.-
marking_groups = MarkingGroups, means that reports will be made for all the groups in MarkingGroups. -
dendrometry = TRUE, etc… makes you able to select topics you want to have in the reports (1 page / topic).
-
Evaluate the simulations on your marteloscope
Now that simulations are running on your computer, look in more detail at simulation reports to check that their predictions are realistic. Do you think the order of magnitude of production is correct? Do you think the regeneration flux is correct? Do you think the natural mortality is correct? Do you think the tree microhabitat evolution is correct?
A model is a strong simplification of reality. Predictions depend on the equations chosen to represent the different processes, on the parameter values in these equations and on the description of the initial state. Processes have been calibrated on large datasets averaging many different conditions and it is inevitable that the specific conditions of your marteloscope are represented quite poorly. If there are big inconsistencies, please let us know.
When analyzing the results of a simulation, you should not concentrate too much on quantitative predictions. It is more interesting to try and understand how the different variables evolve in relation to each other. Are some variables moving in similar directions ? Are other variables moving in opposite directions ? Is a change in one variable the consequence of an earlier change in another ?
The D-Day : Performing a real marteloscope field and simulation workshop
A few days before the field workshop, you have to prepare a new project on your computer and your tablets and test everything. The D day you have to be able to do all the manipulations quickly and smoothly.
Preparing your computer and your tablets before the workshop
On your computer: - Create a directory for your field exercise (ex:
martelosim_Workshops/MyMarteloscope/MyMarteloscope_YYYY.MM.DD)
- Run the script 01_start.R to prepare the initial state
files required for the simulations. - Run the
script 02_test.R to check that everything is working with a
random marking
On your tablets: Transfer from your computer to the tablets the empty
marking file YourMarteloscopeName_YYYY.MM.DD_Marking_X.xlsx
and change the names replacing X by the name of each tablet
Alternatively, prepare your tablets with the I+Trainer software.
Import marking files, make the simulations and produce the reports
At the beginning try not to have too many groups in the field: the more groups there are, the more manipulations there are to do.
- Be very careful that every group save correctly their marking file
on their tablet. If you use the I+ trainer, be especially cautious that
the csv result file is saved correctly using :
Save results on the device-> Save final results on the SD card, create PDF and restart the application - Transfer the marking files from the tablets to your computer.
- Run the script
03_workshop.Rto make the simulations and produce the pdf reports.
Be careful that file names are correct and that you have written all the group names in the vector MarkingGroups.
- Visualize the pdf simulation report of each group and transfer it back to the group’s tablet.
- To share and discuss the results, if you can gather in a room, the best is to project simulation reports using a video-projector. Alternatively, you can print the reports using a portable printer or simply transfer them back to the tablets.
- After the exercise, you can transfer the reports of all groups to all the participants by email.
The transfer of files between tablets and computer is a bit of a pain but is doable. If you are well prepared, the whole process should take about 30 minutes.
Other simulation projects with Samsara2
You can use your marteloscope data to make simulations with Samsara2 for other purposes than field marking workshops. Marteloscope simulation has been standardized to be efficient and fast, but the drawback is that the simulation scenario is not very flexible. In other contexts, you can imagine more complex simulation scenarios using Samsara2 in two ways:
- You can use the CAPSIS interactive interface to make simulations step by step. See the corresponding Samsara2 tutorial and exercise for students.
- You can use the script mode to make a simulation experiment. You have to prepare a command file describing all the scenarios you want to run together. A documentation is in preparation.